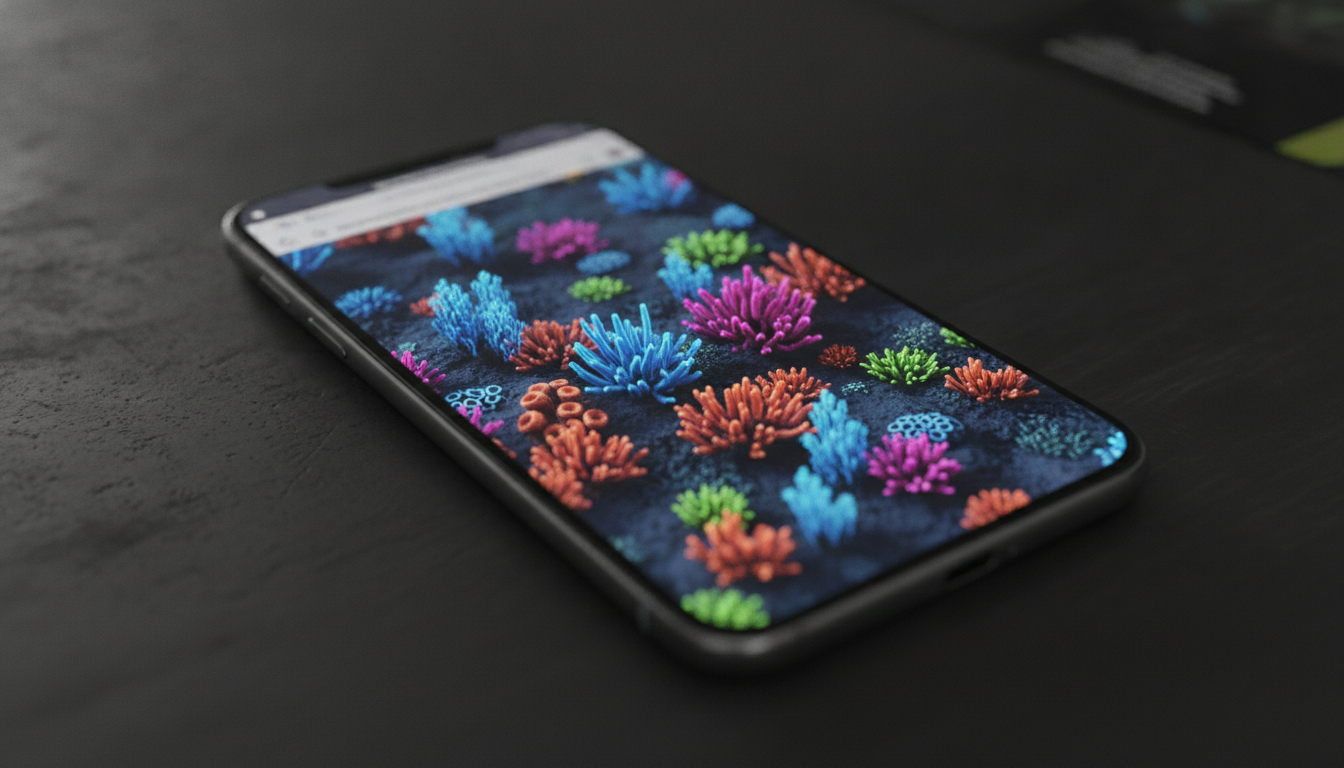
Your research is 3D, dynamic and interactive.
But academic posters are still static.
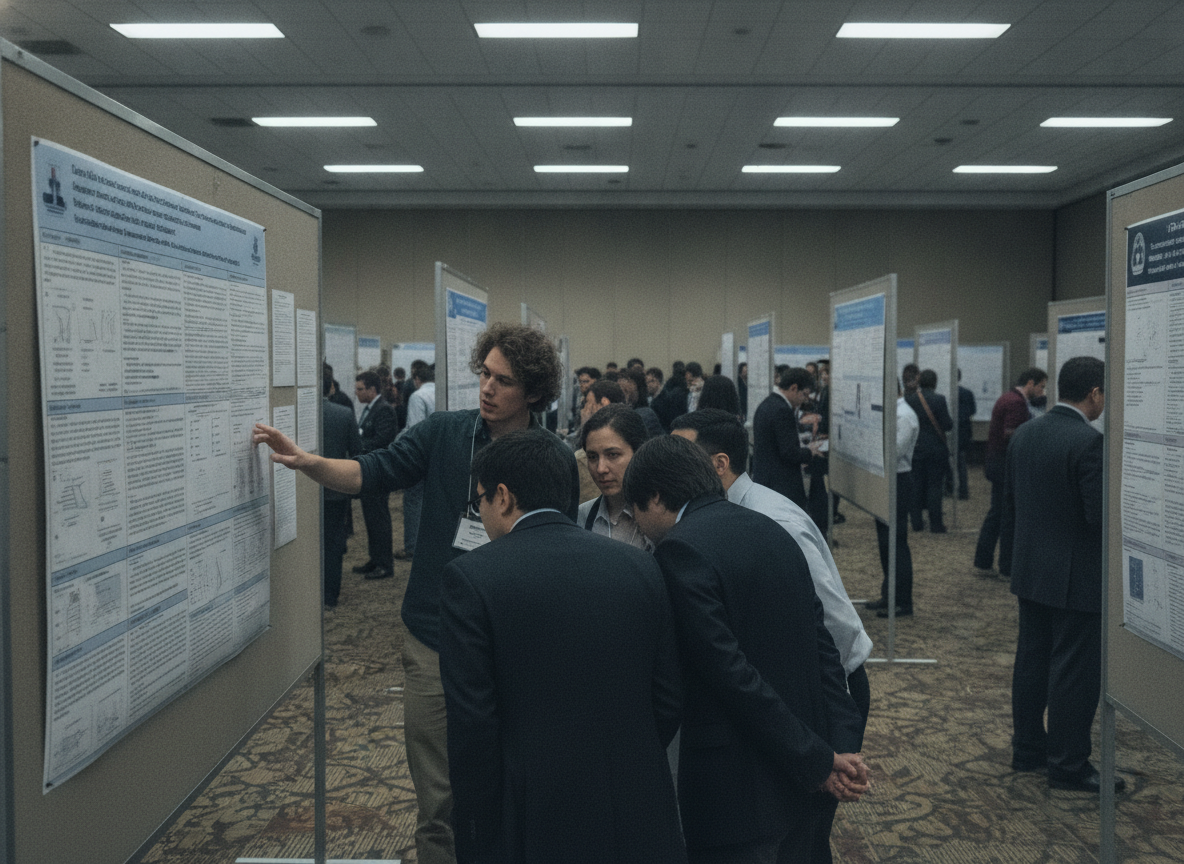
Months of work are compressed into a few minutes at a crowded poster session. A protein structure becomes a screenshot. A simulation becomes a static graph. A CT volume becomes one slice. And when the researcher steps away, the poster can no longer explain itself.
volumes & motion
many simultaneous visitors
the session ends
assets/poster-flat.png · 4:3
A typical conference poster hall, researcher gesturing at a dense static poster, small crowd squinting at tiny figures
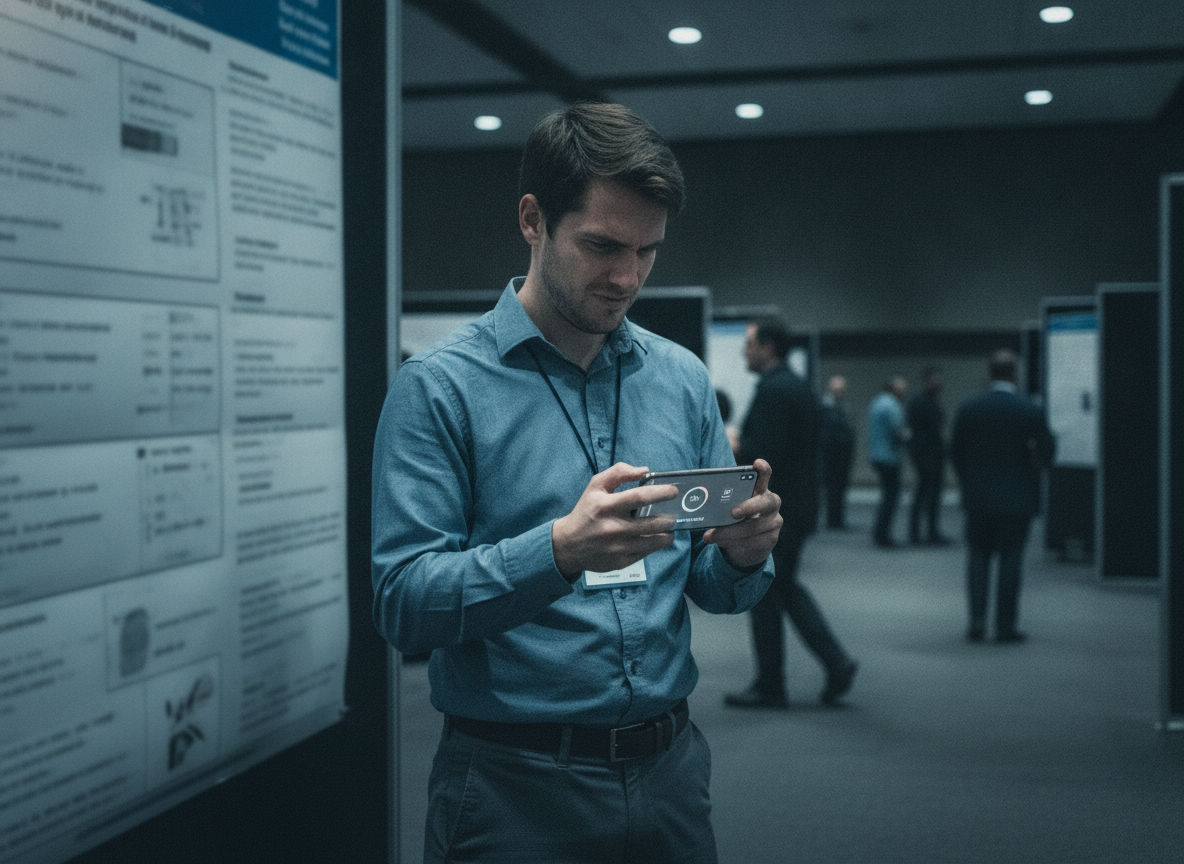
General AR platforms tried to make posters interactive, but they were not built for science.
Most focused on marketing, advertising or art, where engagement was temporary and the use cases were broad. The pattern is consistent, and it tells us exactly where the opening is.
 ✗ Why generic platforms struggled
Everything for everyone
- ✗App-download wall: nobody installs an app to look at one poster.
- ✗Marketing-first design: built for ad campaigns and packaging, not for scientific 3D content.
- ✗Generic authoring: agencies authored the content; the owner of the knowledge couldn't.
- ✗No persistence: experiences were campaign-shaped: launch, expire, vanish.
- ✗No community fit: "AR for anything" means a home for no one.
 ✓ Our position, narrow on purpose
Built for researchers, conferences & institutions
- ✓Zero install: runs in the phone browser. The QR / short code is the entire onboarding.
- ✓Research-native content: 3D models, simulation videos and annotated hotspots out of the box.
- ✓Self-serve authoring: the researcher builds it in a browser editor, no agency, no code.
- ✓The poster outlives the conference: a permanent link that keeps working in the lab corridor and in the paper.
- ✓Shaped by one community: piloted with real researchers, features driven by their workflow.
Create in the browser. Print one QR. Bring the poster to life.
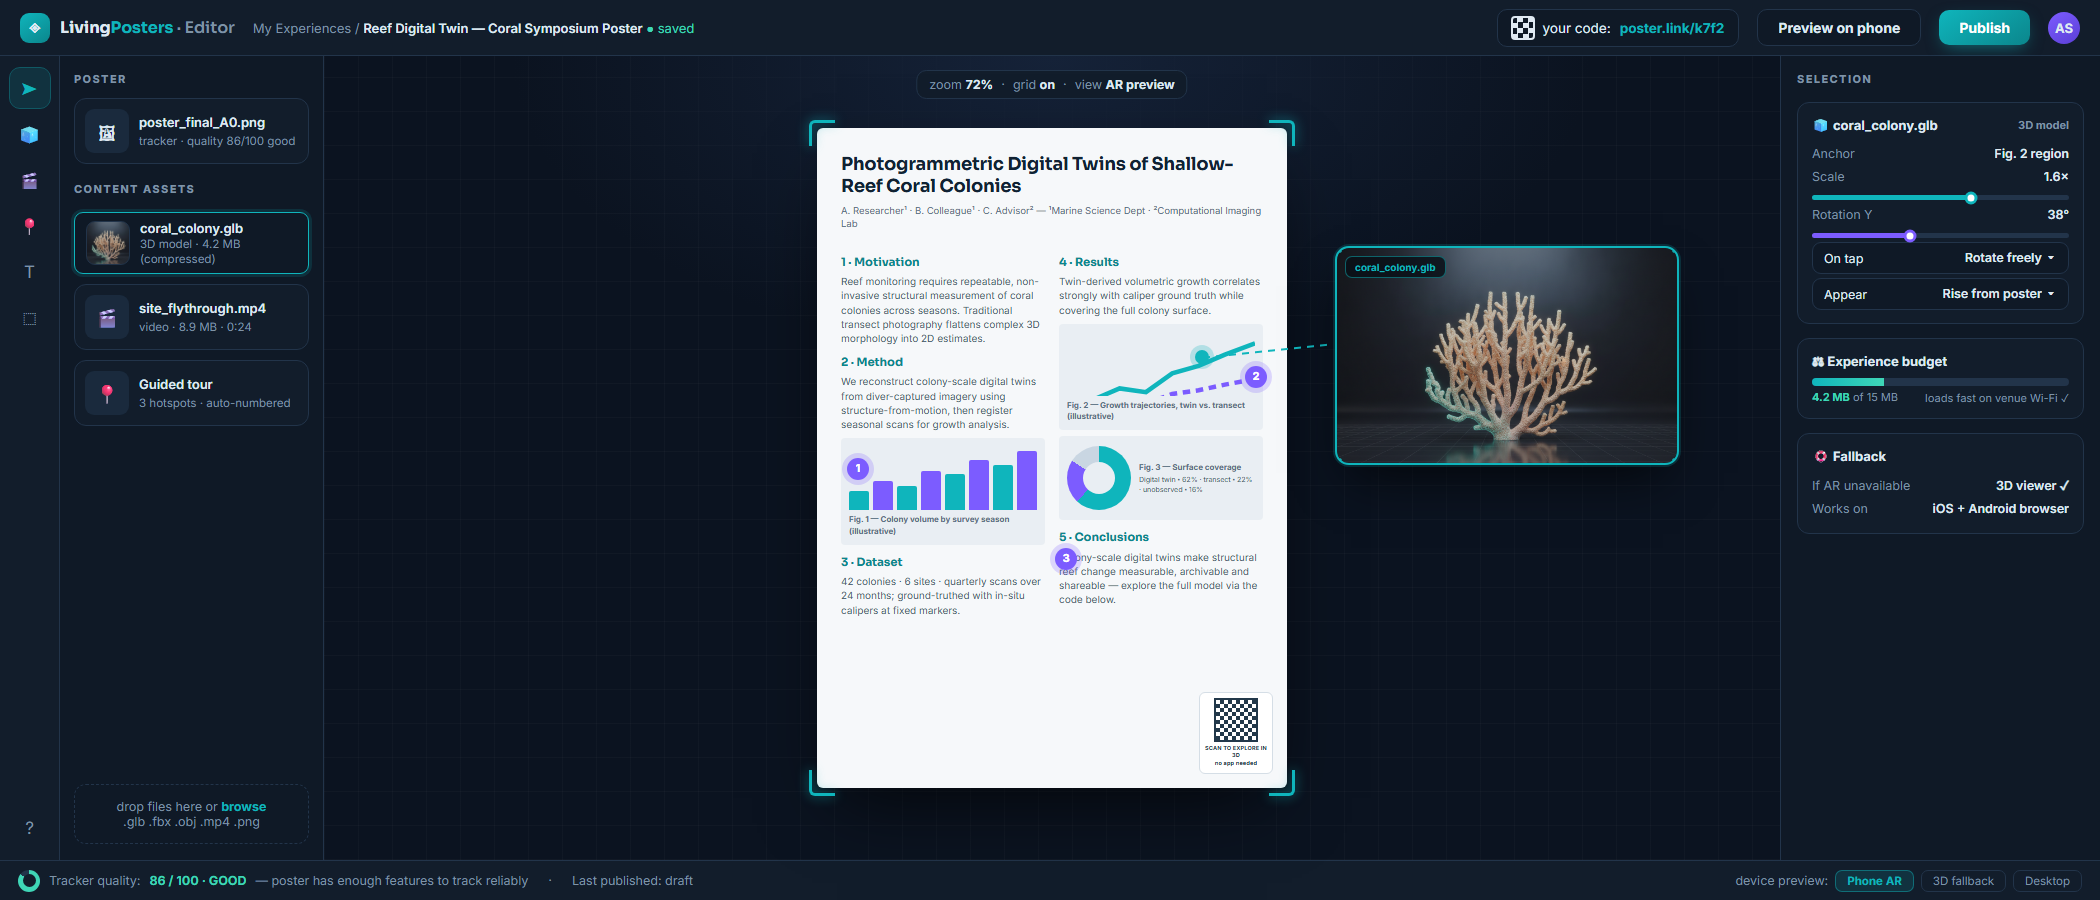
Upload your poster, add interactive layers and publish a WebAR experience in minutes.
📤 Upload & create
Upload your poster image and your content: a 3D model, video or figures. Drag them onto the poster in the browser editor and pin them where they belong.
🔗 Get your code
Every experience gets a short link + QR (e.g. poster.link/k7f2). Add it to the corner of your poster before printing. That is the only change.
📱 Visitors scan
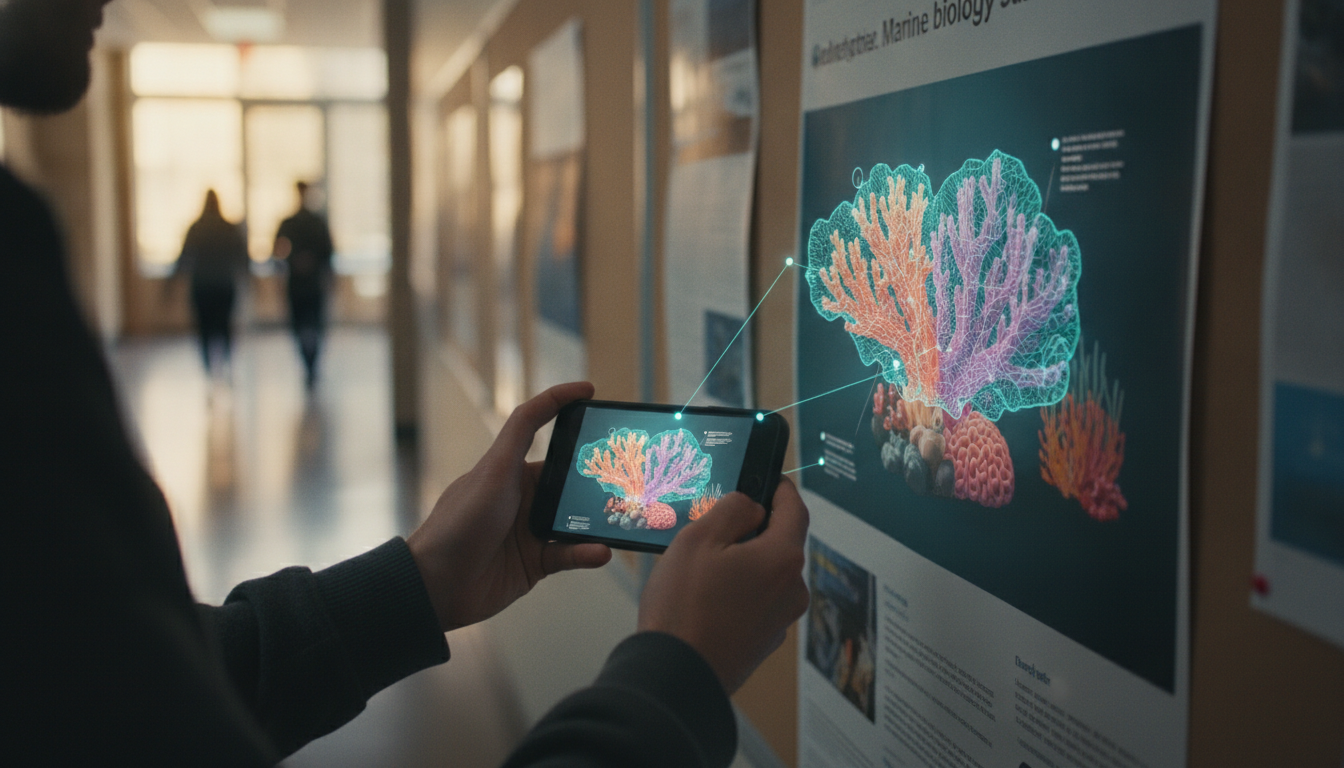
Anyone opens the link in their phone browser, points the camera at the poster, and the content appears tracked on the paper. No install, just seconds to first wow.
assets/editor.png · 21:9
The browser authoring editor: research poster on canvas, 3D coral model being dragged onto it, properties panel on the right
If it doesn't fit on paper, it belongs in the AR layer
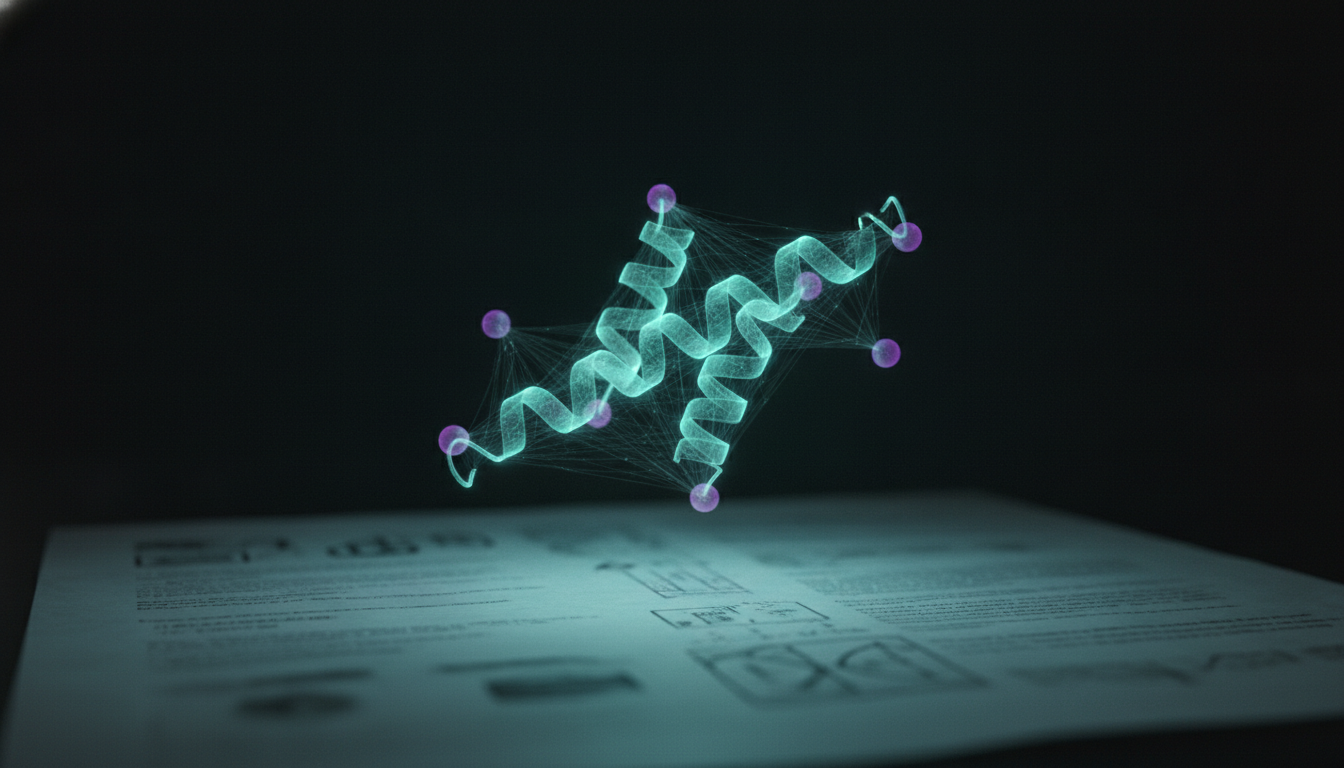
Molecules & proteins
Rotate the actual 3D structure on the poster instead of three cherry-picked viewpoints.

Imaging & scans
CT/MRI/microscopy volumes explored slice by slice, not one frozen cross-section.
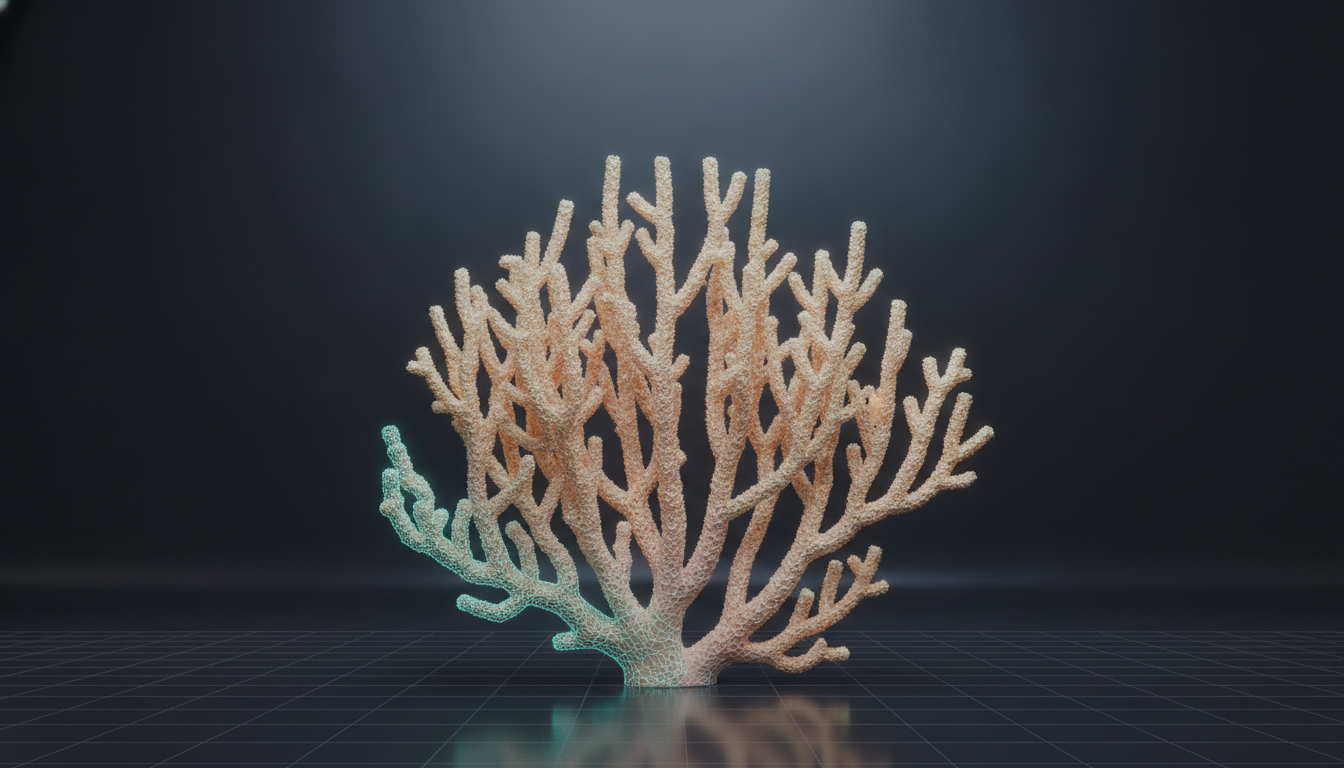
Field & environment
Coral reefs, outcrops, photogrammetry: walk the audience through the actual site model.
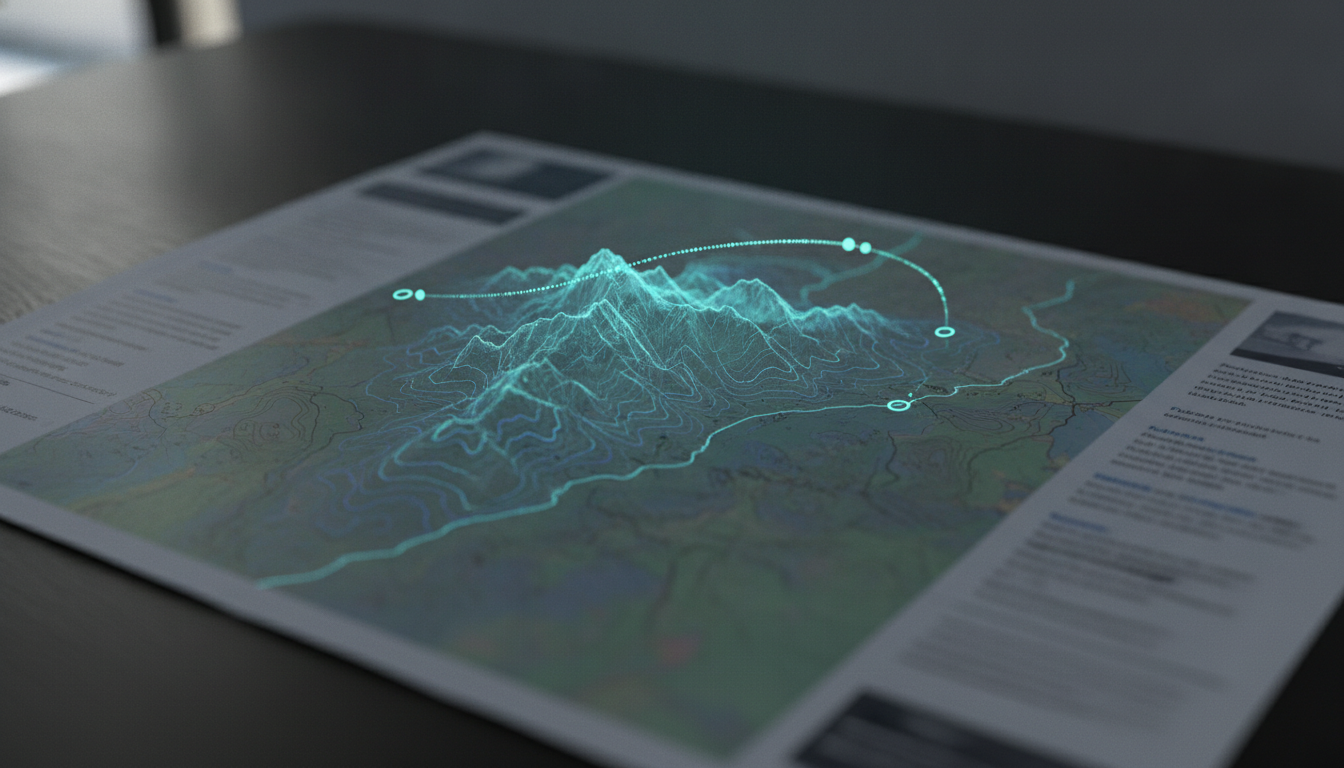
Drone & terrain data
Flight paths, terrain meshes and detections rendered over the study-area map on the poster.
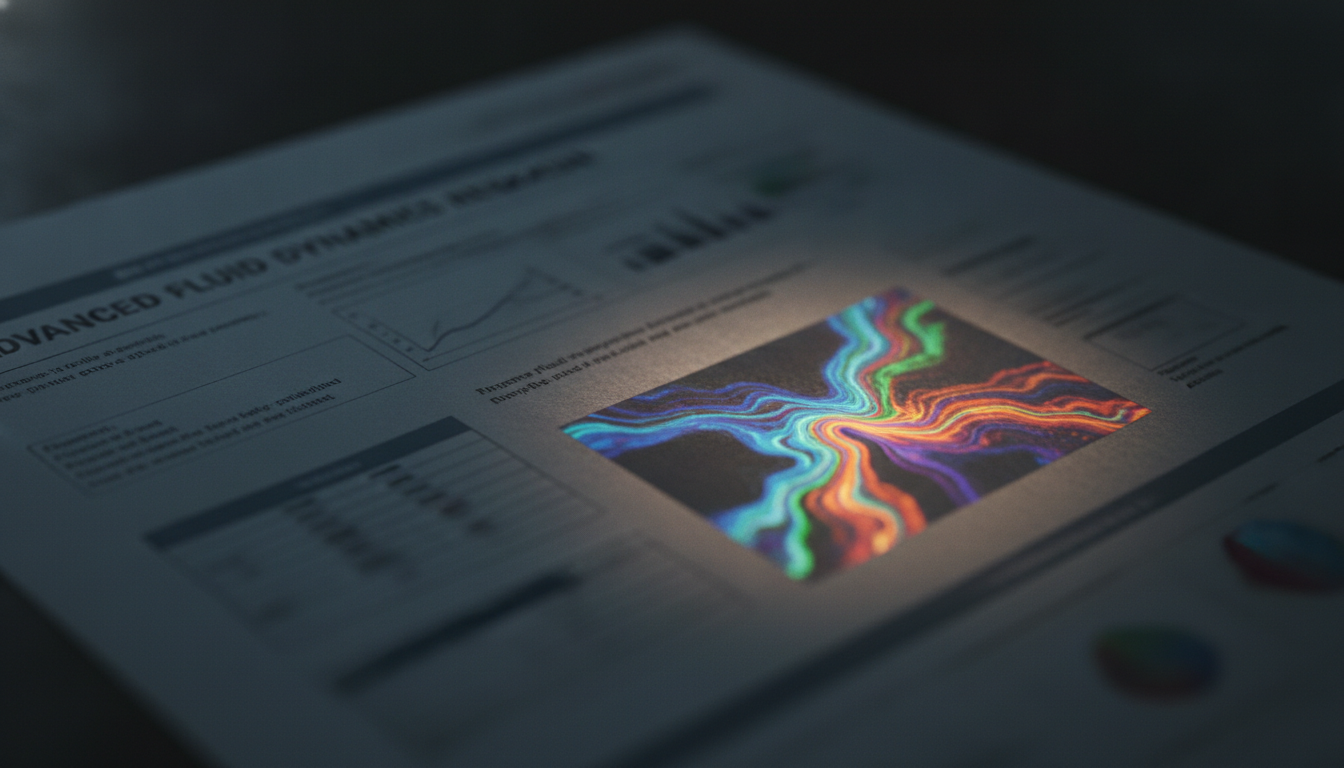
Simulations & video
The time-evolving result plays on the poster: flow fields, training runs, animations.
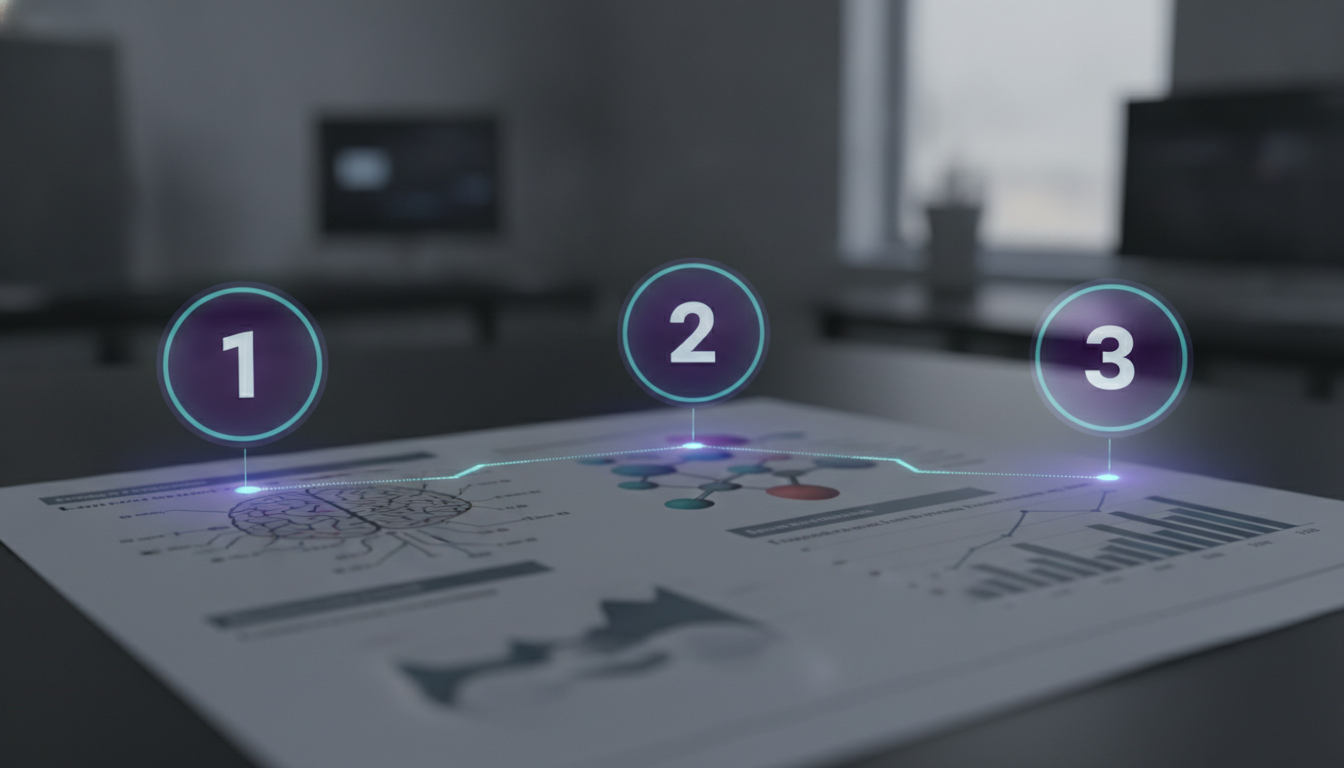
Hotspot walkthrough
Numbered hotspots guide a self-served tour of the poster: your talk, delivered while you're at lunch.
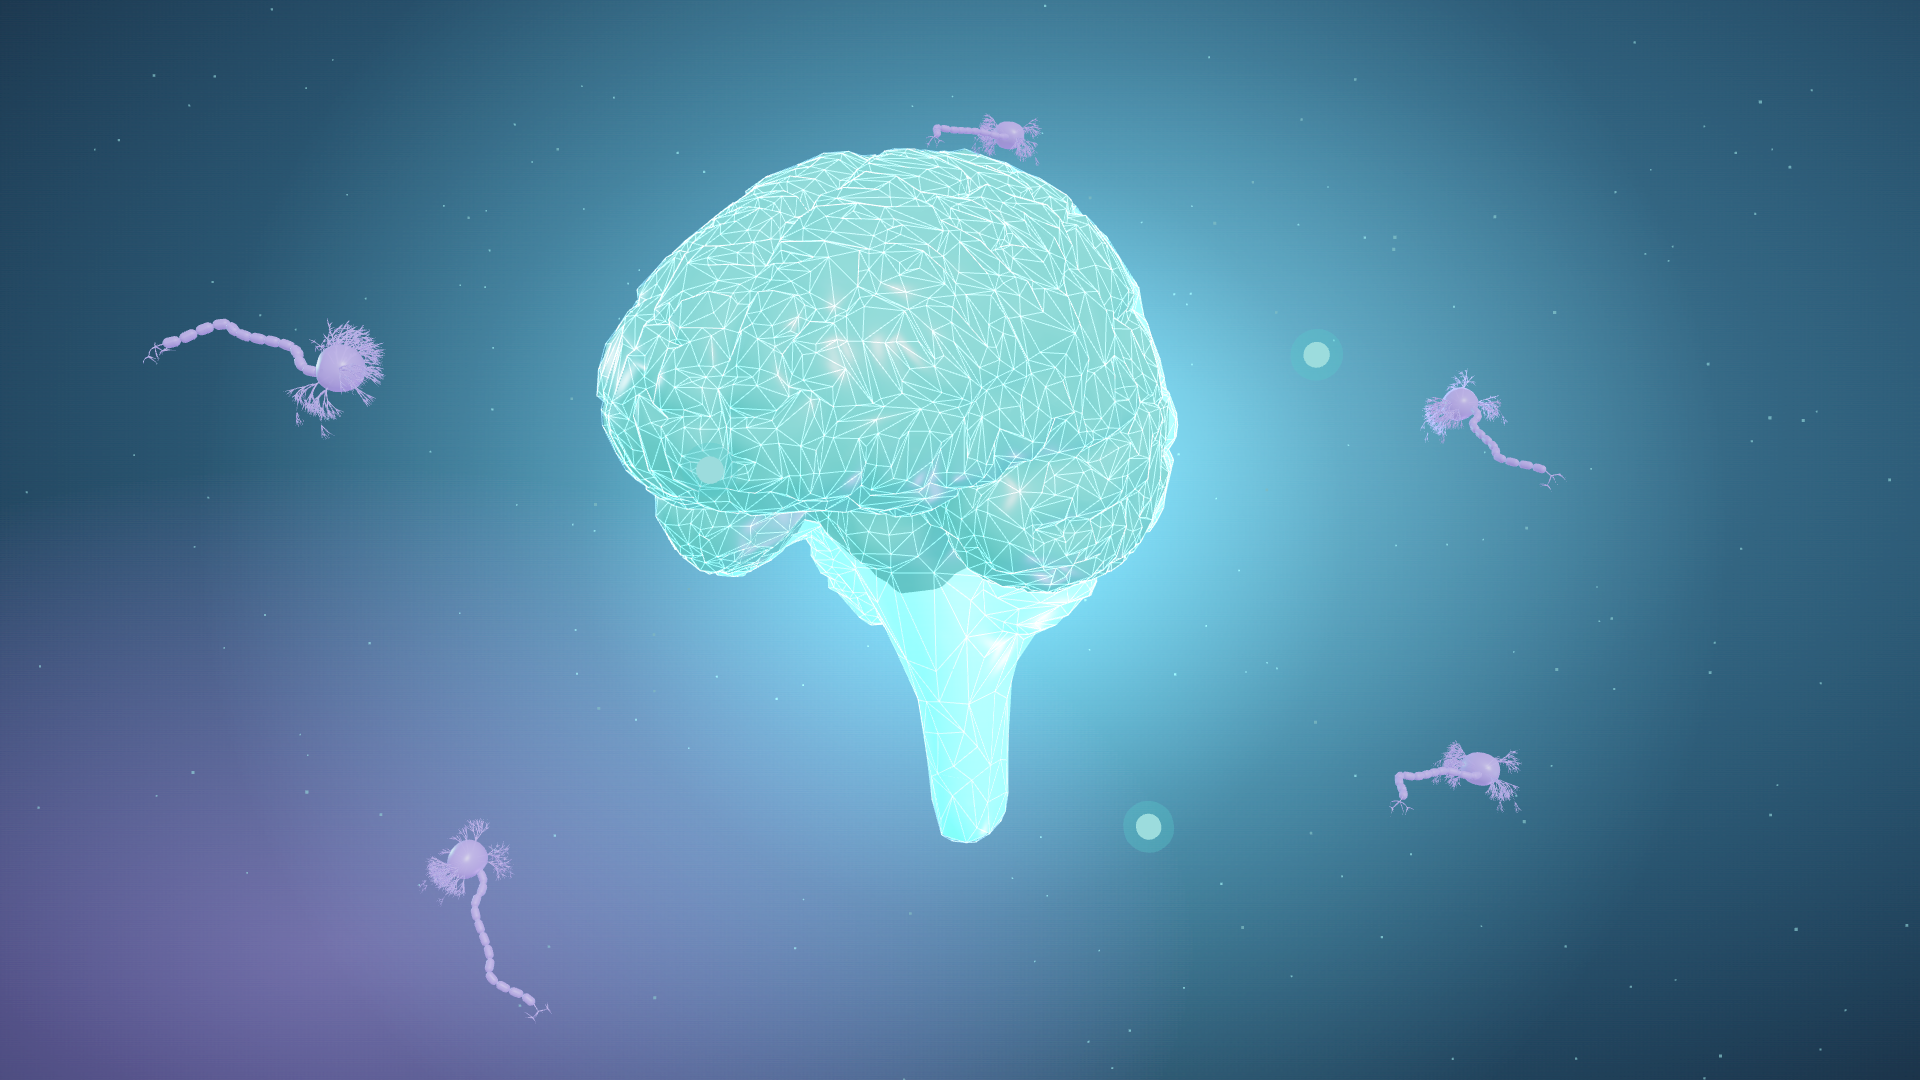
The brain lifts off the poster
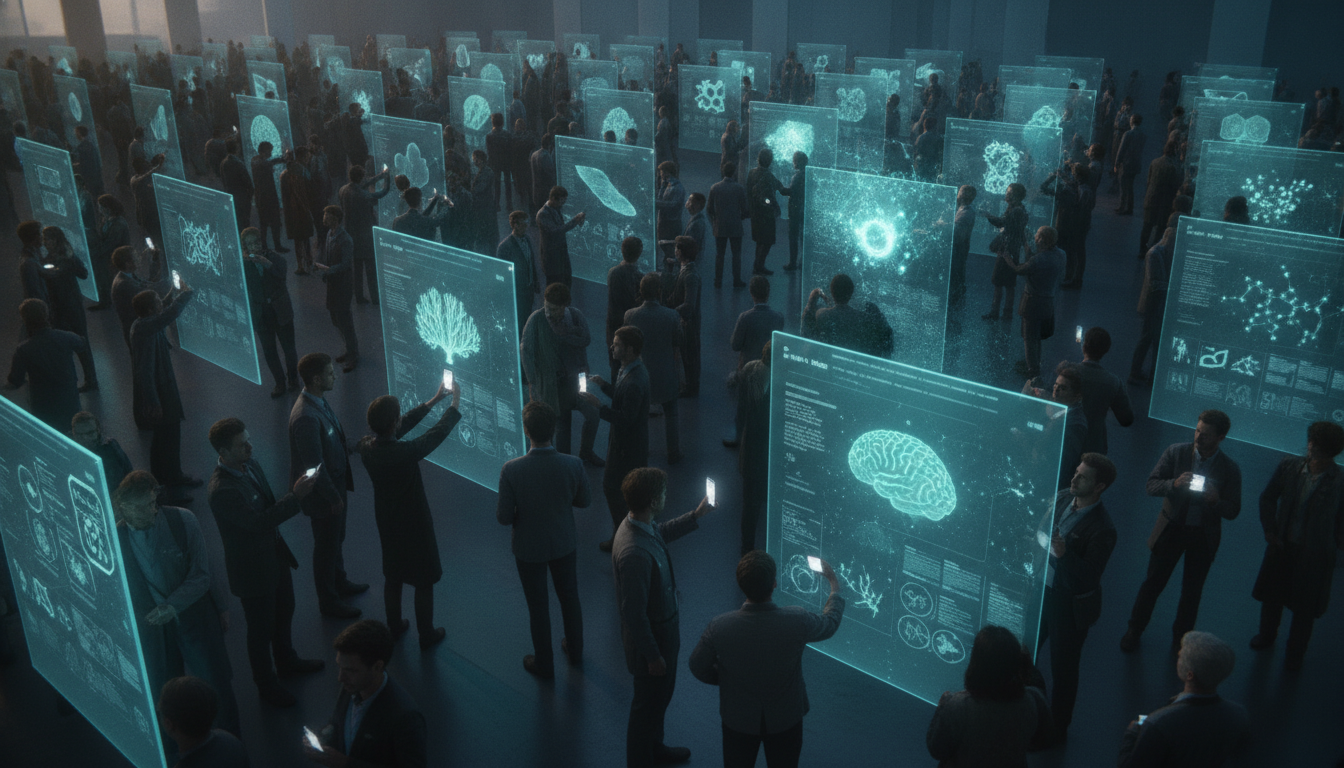
A flat figure becomes an explorable 3D brain: rotate it, follow the neurons, and read the structures the poster only had room to name. The visitor explores it alone; the researcher steps in only for the questions that matter.
after the session
Three people win at every poster
🔬 Stand out & scale yourself
Your poster demos itself to five visitors at once: richer evidence (the real 3D data, not a screenshot), and visitors remember the poster that moved.
👀 Understand faster, deeper
Spatial data understood spatially, self-paced instead of queuing for the presenter. Take the link home, and the material survives the hallway conversation.
🏛 Visible, modern science
Corridors, open days and tours become interactive with zero hardware, so every poster already on the wall can become a live exhibit.
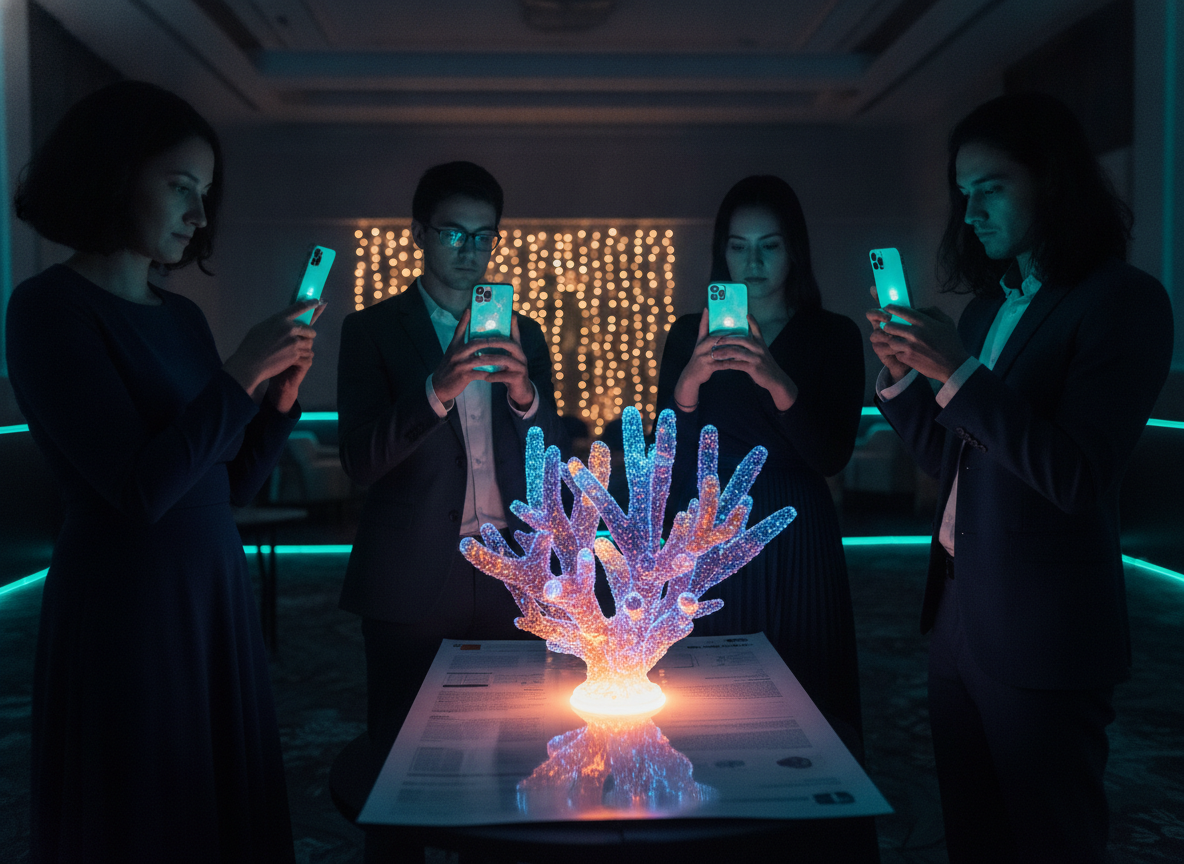
Unlike a QR link to YouTube, the content appears on the poster itself, in context, anchored to the exact figure it explains.
What WebAR can't do, and how we design around it
We'd rather you hear the constraints from us. Each one has a concrete mitigation.
Low-texture or glossy posters track poorly; bad lighting hurts recognition.
The editor scores the poster image for trackability and flags weak regions before you print.
WebAR rendering and tracking are less powerful than a native ARKit/ARCore app.
A dedicated lightweight player build; if AR fails, the same link opens a full-screen 3D viewer, so nobody hits a dead end.
Crowded venues mean slow first loads for 3D content.
Model size limits with automatic compression guidance; content served from edge CDN; small experiences by design.
If creating an AR poster feels like extra work, researchers will try it once and stop.
Create and publish in one short, guided flow: upload, drop content, done. Fast enough to feel effortless, refined with the pilot group.
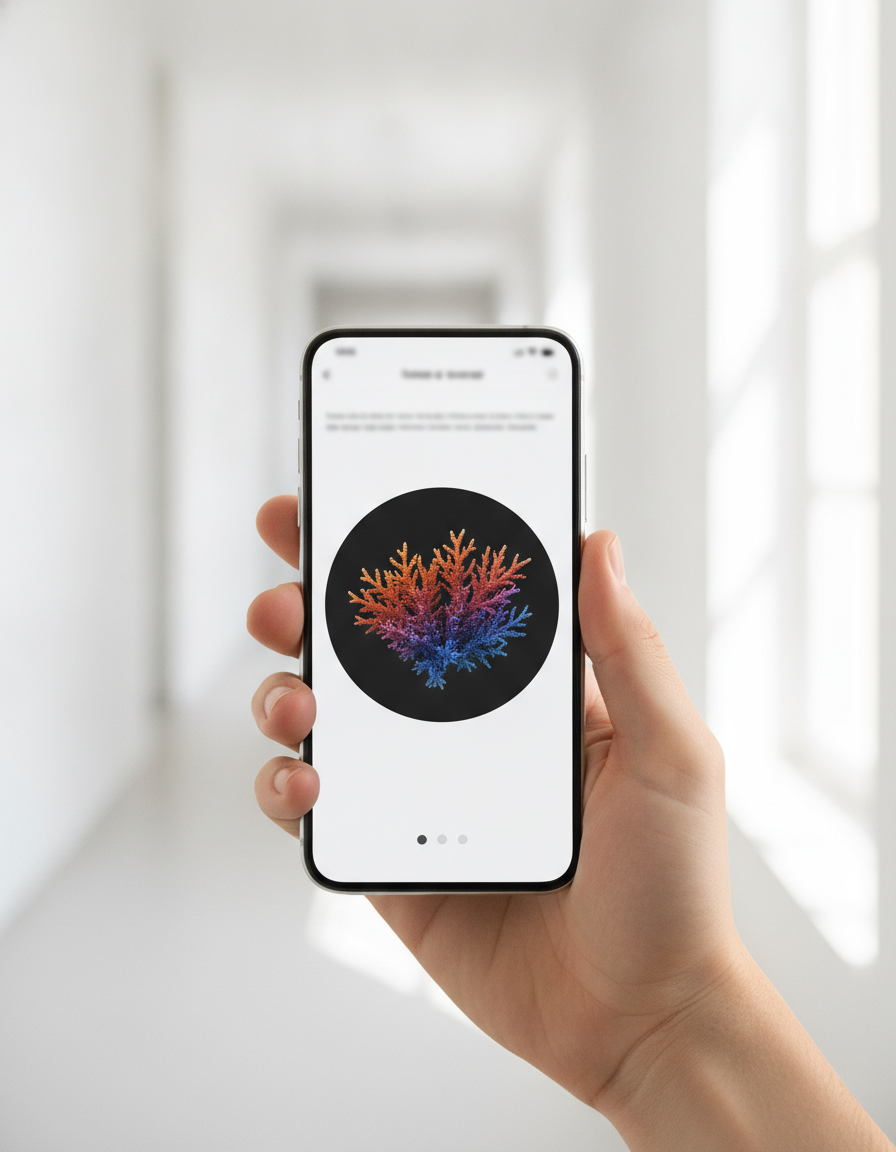
Deliberately focused. Deliberately achievable.
The MVP proves one complete workflow: create → publish → scan → explore. Everything else is guided by researcher feedback.
- ✓Browser editor: upload poster, place 3D models / videos / hotspots
- ✓3D model import (.glb / .fbx / .obj) with automatic materials
- ✓Short code + QR per experience (/k7f2)
- ✓Phone-browser AR player with image tracking on the poster
- ✓Non-AR 3D fallback viewer (same link)
- ✓Sign-in for authors; public viewing without accounts
- →Volume rendering (CT/MRI), pilot decides priority
- →Reusable lab templates (kept for a later version)
- →Analytics dashboards & view counts
- →DOI / citation integration, paper linking
- →Multi-poster team & lab management
- →Conference-organizer bulk tools
- →Any pricing/marketplace machinery
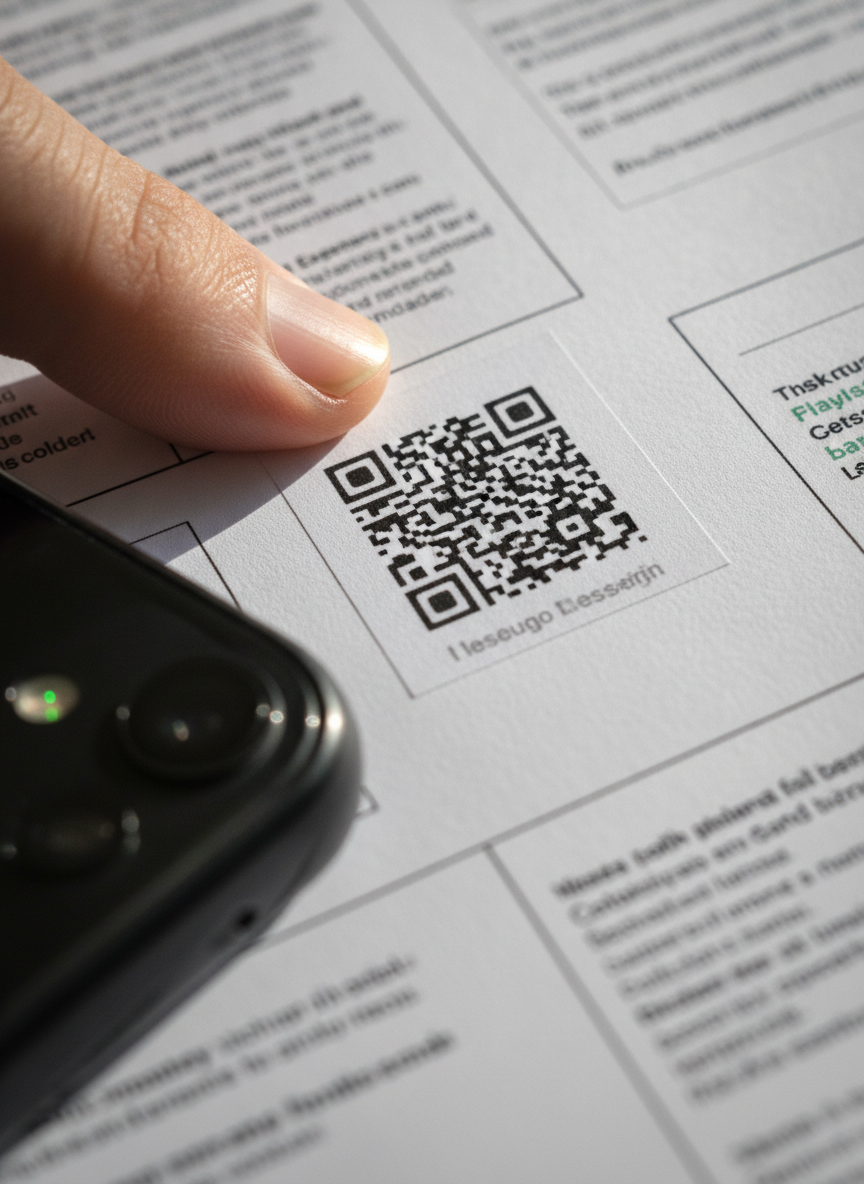
Built alongside researchers
The MVP launches as a closed pilot with a small group of researchers. They create real posters for real sessions, and every point of friction becomes a product improvement.
🎯 What we measure
Time-to-publish per poster · scan success rate on real phones · visitor engagement · the content types researchers use most.
🔁 The feedback loop
Built alongside researchers → we remove friction → they publish independently. The MVP succeeds when a researcher can create and publish an interactive poster quickly and confidently, with no help and no learning curve.
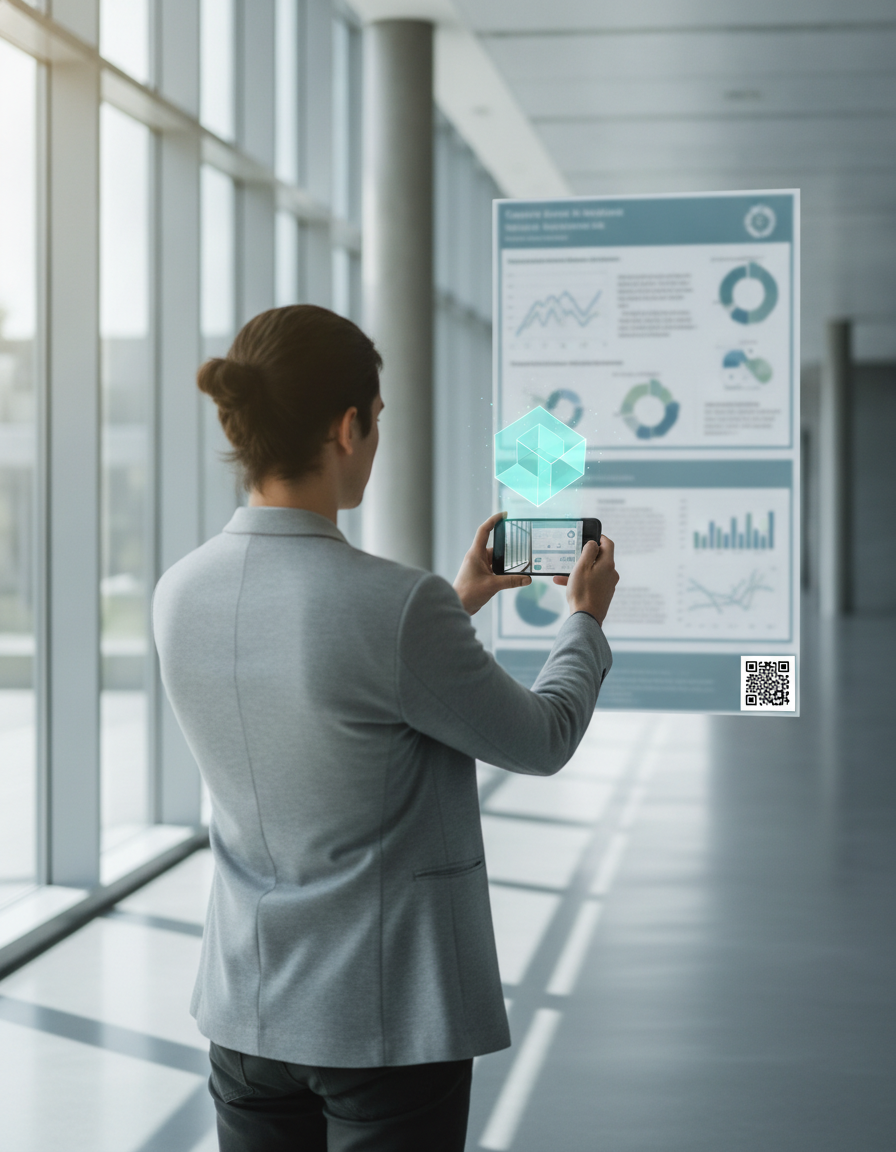
assets/pilot-poster.png · 4:5
A research poster on a corridor wall with a clean "Scan to explore in 3D, no app needed" QR badge in the corner, phone mid-scan
Born in the lab where research comes to be seen
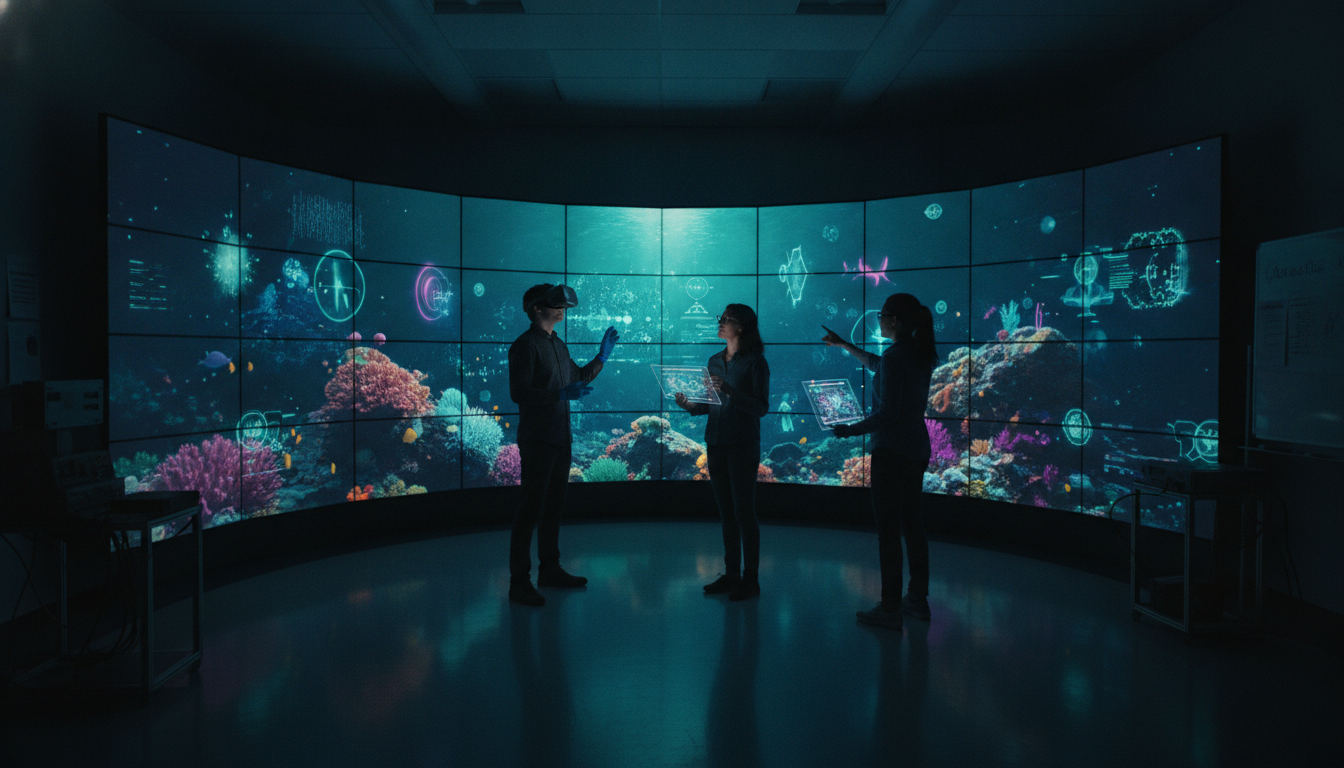
The Visualization Core Lab (KVL) is the campus interaction point for scientific visualization, where every group that needs its data seen already walks through its doors. No other place concentrates the users, the hardware and the visibility this product needs.
🧲 The natural funnel
Researchers from every department bring their data here to visualize, so pilot users are recruited at the front desk, not by cold email.
🧪 The instant test bed
Display walls, a CAVE, a full fleet of phones & headsets, and real posters in real corridors: every device the player must support is already on the shelf.
📣 The trusted promoter
Lab tours, training events and open days continuously put living posters in front of visitors, students and leadership, so promotion is built into the lab's routine.
🔁 The feedback engine
Lab staff see daily where researchers struggle with 3D data. That knowledge (what formats arrive, what conversions fail) feeds straight into the editor.
From foundation to the research community
Principle: Research comes first. Phase 3 evolves from what researchers actually need, not from what we assume they need.
A single WebAR engine powers every experience
Researchers create and publish new posters without app updates, rebuilds or developer support. Each experience is loaded dynamically, making the platform easier to maintain, faster to scale and simpler to deploy.